

Caution! This is a technical piece. Please read it slowly.
Recently, I was introduced to the client letters of Semper Augustus by KC Lau. In brief, Semper Augustus Investments Group LLC is a US investment advisory firm that adopts value investing principles in building its clients’ portfolios. For every year since 1999, Semper Augustus published its annual letters to its clients. The letters are lengthy (100+ pages each) and they contain gems of wisdom that are highly applicable to US stock investors.
I believe KC reads them as part of his investment education and I follow suit.
Frankly speaking, the letters aren’t easily digestible. It is not Rich Dad Poor Dad. So, what I will do is to break my studies into smaller parts that are “chewable”. I am now reading its 2023 SAI letter where it discusses the 6 factors which would be most impactful to a stock’s total return over the long-term (Page 41).
In Part 1, I’ll just expound my thoughts on the first 3 out of the 6 factors written in the letter. Here, I’ll start off with the basics and raise its technicality as I write the latter pages. So, sit back, chill, and let’s begin.
The Formula to Total Returns
Let’s begin with what all of us know. Today, stock returns are assessed based on 2 things: (1) capital gains and (2) dividend yields.
Total Returns = Capital Gains + Dividend Yields
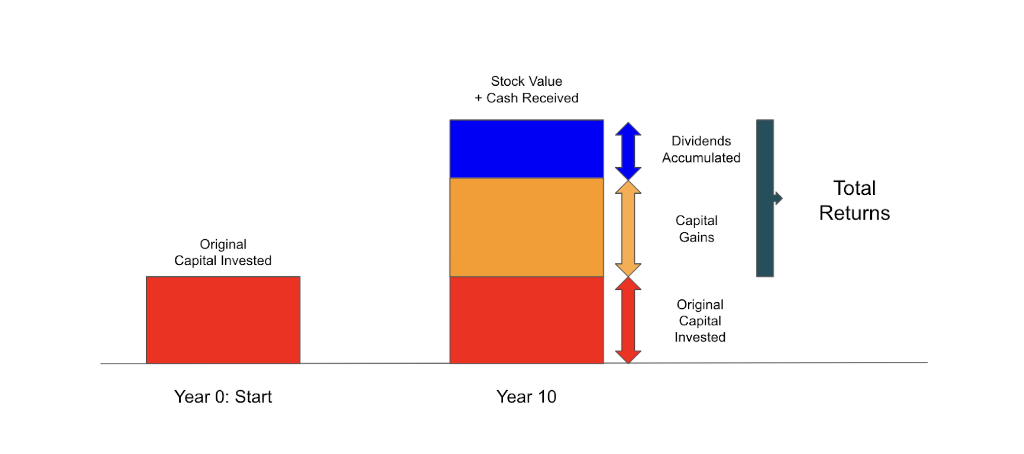
Capital gains are impacted by 2 main factors: (1) EPS Growth and (2) Changes in P/E Ratio. So, this leads us to have the formula below:
Total Returns = (EPS Growth + Changes in PE) + Dividend Yield
To understand this, let’s work on a case study.
For example, we are looking to invest in A Inc in Year 0 (start). The company has made $100 million in earnings. Based on 100 million shares, A Inc would record $1.00 in earnings per share (EPS). The stock price of A Inc is $20 a share. Hence, its shares are valued at P/E Ratio of 20.
Stock Price = $20.00
EPS = $1.00
P/E Ratio = 20.
Scenario 1: A Inc is a Dividend Stock
Let’s say we intend to hold onto A Inc for 10 years. In that period, A Inc paid out 100% of its EPS to shareholders in the form of dividends. Thus, its dividends per share (DPS) is $1.00. The company has succeeded in maintaining its earnings on an annual basis at $100 million and kept its number of shares at 100 million. So, its EPS has maintained at $1.00 for the 10-year period.
Also, its valuation remains constant at P/E Ratio of 20.
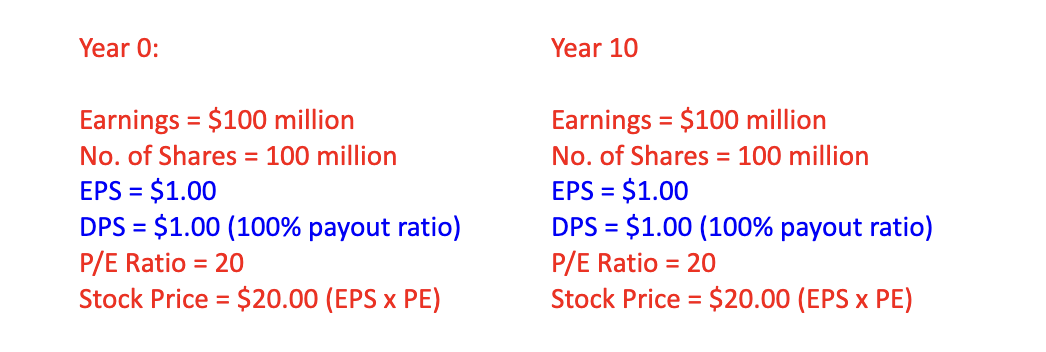
So, what is your total return?
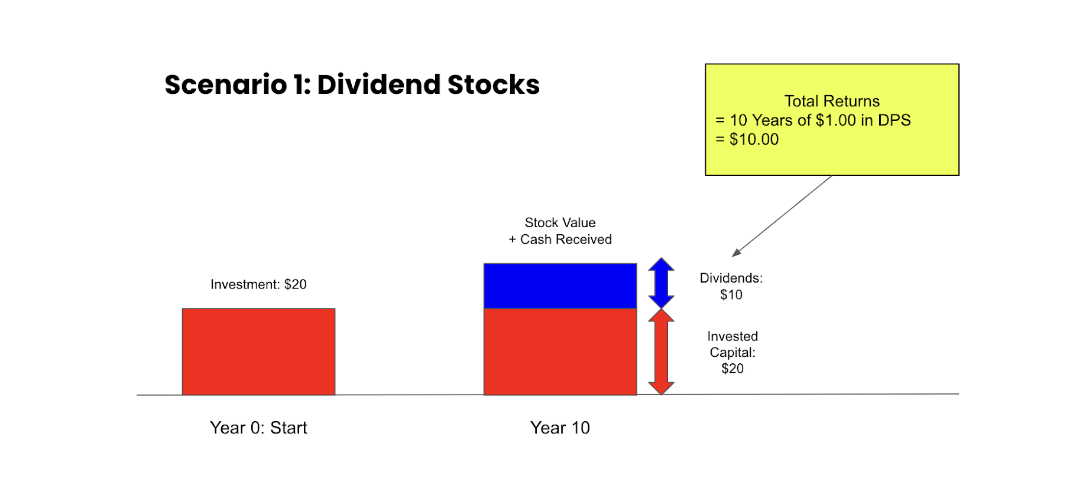
In Year 0, we’d invested in A Inc at $20 a share. 10 years later, its stock price has remained at $20 a share. So, our capital gain is 0%. But, we have received $1.00 in DPS for the past 10 years. This works out to be 5% in dividend yields per year. Therefore, our total return from this investment is 5% per annum.
Total Returns
= (EPS Growth + Change in PE) + Dividend Yields
= (0%) + ($1.00/$20.00 x 100%)
= 5%
Scenario 2: A Inc is a Growth Stock
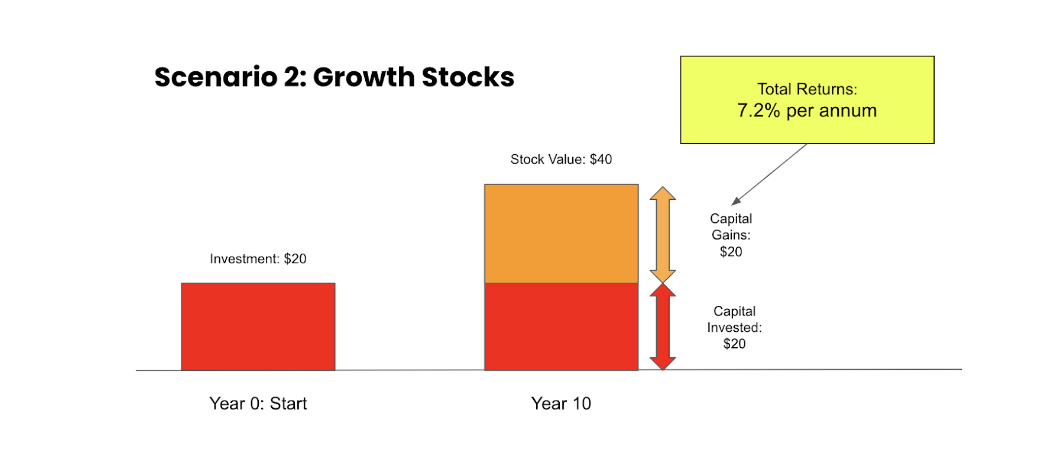
Now, what if A Inc doesn’t pay out dividends? Instead, A Inc chooses to reinvest all of its earnings in the 10-year period to grow its business. Out of which, it has successfully grown its earnings at a CAGR of 7.2%, doubling its earnings to $200 million in Year 10. The company has kept its number of shares at 100 million. As such, its EPS in Year 10 is $2.00.
Also, its valuation remains constant at P/E Ratio of 20.
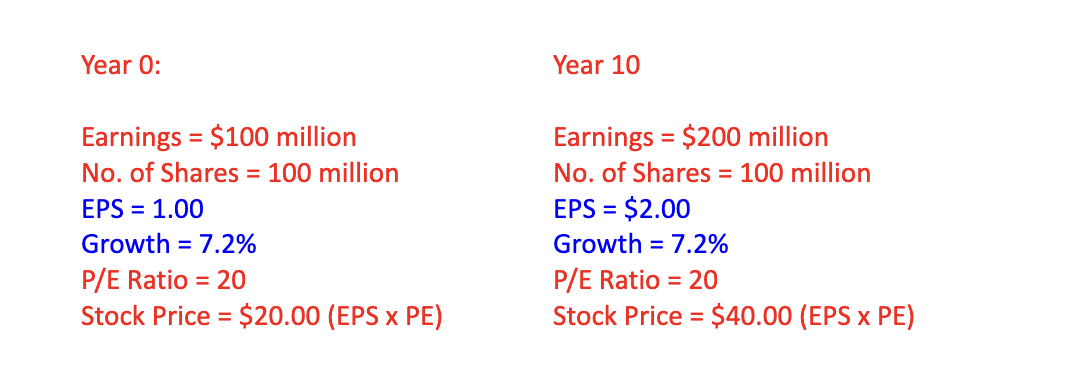
In this situation, our total return from this stock is calculated as follows:
Total Returns
= (EPS Growth + Change in PE) + Dividend Yields
= 7.2% + 0%
= 7.2%
At this rate, you could 2x your capital in 10 years, which is what happened for A Inc.
Scenario 3: Growth in PE Multiples
Let’s build from Scenario 2.
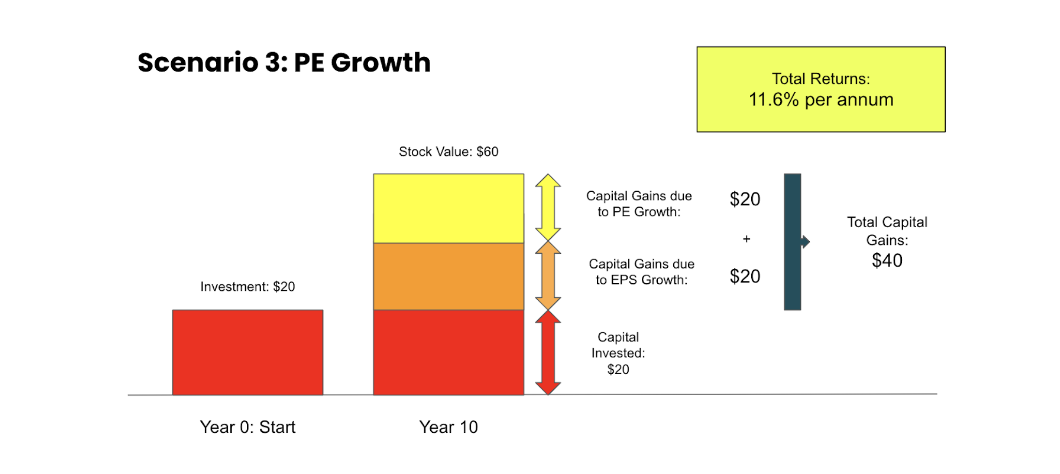
Now, what if the P/E Ratio of A Inc grew from 20 in Year 0 to 30 in Year 10? How would that impact our total returns? Well first, the stock price of A Inc will grow to $60. You’ll 3x your capital instead of 2x in Scenario 2. With a CAGR calculator, we could find that our total return is 11.6% a year in that 10-year period.
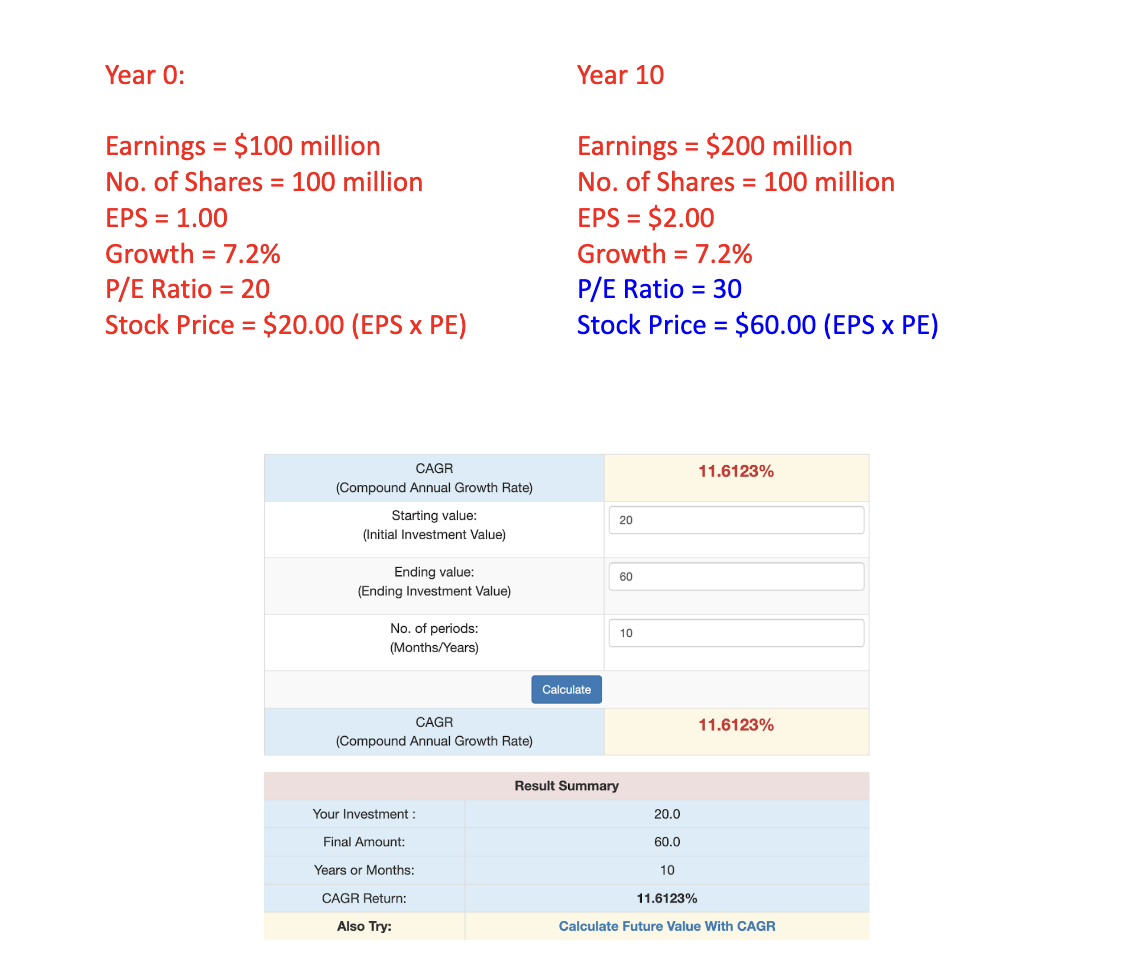
Source: CAGR Calculator
The total return is 4.4% a year higher than in Scenario 2 and this is attributed to an increase in PE from 20 to 30 in that 10-year period.
Total Returns
= (EPS Growth x Change in PE) + Dividend Yields
= (7.2% + 4.4%) + 0%
= 11.6%
Time for a Coffee Break
At this junction, we’d covered 3 out of the 5 factors as follows:
Factor 1: Dividend Yields
Factor 2: EPS Growth
Factor 3: Changes in PE Multiples
Also, we have learnt that the main drivers for capital growth are Factor 2 and 3. Of which, Factor 2 is one that we could assess from a stock’s financial reports. It is not quite possible to determine a stock’s future PE in the next 10 years. Thus, as investors, the practice is to calculate a stock’s average PE and expect its PE to remain relatively constant for the next 10 years. Any rise in PE would be treated as a nice bonus.
Hence, I would just focus on identifying stocks with EPS Growth (Factor 2). Such would be our focus in Part 2 of this write-up. Stay tuned for it.
Resources:
Semper Augustus Client Letters
Here, if you intend to build a Growth-based Portfolio filled with the top 1% companies listed in the United States, check out our free 1-Hour online webinar training on growth investing:
